
Some time ago we changed how Bootzooka handles HTTP requests.
My goal is to compare two great tools:
- complete web framework scalatra 2.3.1 (latest stable)
- called by one of it’s project leaders a web toolkit akka-http 2.4.2
from a performance perspective. I find both of them very helpful but they work in different ways so the idea is to see how much that impacts the application and it’s users.
Whenever you buy a car - you look at its specification. How fast it is, how amazing is the acceleration, how much petrol does it burn, how much load it can carry. I’d like to know such metrics for tools I use to build web applications. Authors don’t always publish such metrics and often Google doesn’t find any. One such metric would be to compare benchmarks but there are none so let’s make a comparison.
From the Great Jez Humble’s Continuous Delivery book, introduction to chapter 9, comes the definition of app performance:
First of all, let’s clear up some confusion around the terms. We’ll use the same terminology as Michael Nygard.1 To paraphrase, performance is a measure of the time taken to process a single transaction, and can be measured either in isolation or under load. Throughput is the number of transactions a system can process in a given timespan. It is always limited by some bottleneck in the system. The maximum throughput a system can sustain, for a given workload, while maintaining an acceptable response time for each individual request, is its capacity. Customers are usually interested in throughput or capacity. In real life, “performance” is often used as a catch-all term; we will try to be rather more careful in this chapter.
So I’ll try to find throughput and capacity for each versions of bootzooka.
Brief details of tested tools internals
The version of Scalatra that I’ve tested works in synchronous & blocking way while akka-http is by default “reactive” (asynchronous and non-blocking - ”reactive” trait might be easily lost when the implementation is blocking, so our code also needs to process asnychronously).
Scalatra is thread based, handling servlets and requires servlet container like jetty to run, it can delegate work to akka (from its docs, never tried this one), while akka-http is actor per request, doesn’t require a container and writing actor model code is more natural pattern to follow in this case. Both have comparably pleasant DSLs for writing routes.
Setup
Equipped with gatling.io (for generating fake traffic of user scenarios) and GCViewer (for watching a memory consumption, this is influenced by Bartek’s post to see if something spectacular is going on) I can measure what happens to my beloved framework (bootzooka) after switching web frameworks.
The test was performed on macbook pro, 2,5 GHz Intel Core i7 with 16 GB of ram. I use default JVM flags what is Xss=1 MB (thread stack size) and InitialHeapSize ~ 260 MB and Xmx ~ 4 GB (note: heroku 1 dyno standard is 350 MB).
$ java -XX:+PrintFlagsFinal version
    uintx InitialHeapSize                          := 268435456
    uintx MaxHeapSize                              := 4294967296
    uintx MaxNewSize                               := 1431306240
    uintx NewSize                                  := 89128960
    uintx OldSize                                  := 179306496
     intx ThreadStackSize                           = 1024
I’m running postgres 9.4 database locally with two separate schemas one for each scalatra and akka-http versions of bootzooka. So database configuration is same for each system. Gatling scenarios are being run on same local machine as bootzooka backends are deployed ( frontend is written in angular and it’s performance is fine). This configuration is a kind of “lab environment” where network latency and bandwidth doesn’t play any role, there is no data transmission over the wire what often is the main issue of webapp performance.
- Scalatra bootzooka version (tag last-scalatra)
- Akka-http bootzooka version for this commit
- Repository with simple scenario for the test
Provisioning
The newbootzooka schema is for akka-http bootzooka version and oldbootzooka schema is for scalatra.
export DATABASE_URL=postgres://newbootzooka:newbootzooka@localhost:5432/newbootzooka && \
java -Dserver.port=8081 -Xloggc:newbootzooka-$(date +"%Y-%m-%d_%H-%M-%S").log \
-XX:+PrintGCDetails -XX:+PrintGCDateStamps -verbose:gc -jar new-bootzooka/bootzooka.jar

export DATABASE_URL=postgres://oldbootzooka:oldbootzooka@localhost:5432/oldbootzooka && \
java -Dembedded-jetty.port=8082 -Xloggc:oldbootzooka-$(date +"%Y-%m-%d_%H-%M-%S").log \
-XX:+PrintGCDetails -XX:+PrintGCDateStamps -verbose:gc -jar old-bootzooka/bootzooka.jar
Scenario
It’s very basic as bootzooka doesn’t do complicated stuff. In the first step user goes to /, waits for http 200 code and in second sends post request (to /api/users/register) to register himself and awaits for success string in response body.
Scenario setup 1
Throwing at each system 200 users at once just to see what happens BootzookaRegistrationScn
Bootzooka akka-http version:
./gradlew -Dserver.port=8081 loadTest
First round results:
    ================================================================================
    ---- Global Information --------------------------------------------------------
    > request count                                        400 (OK=387    KO=13    )
    > min response time                                     18 (OK=18     KO=111   )
    > max response time                                   3991 (OK=3991   KO=1227  )
    > mean response time                                  1364 (OK=1397   KO=403   )
    > std deviation                                       1226 (OK=1232   KO=331   )
    > response time 50th percentile                        957 (OK=1103   KO=333   )
    > response time 75th percentile                       2445 (OK=2446   KO=552   )
    > mean requests/sec                                 79.586 (OK=77     KO=2.587 )
    ---- Response Time Distribution ------------------------------------------------
    > t < 800 ms                                           170 ( 43%)
    > 800 ms < t < 1200 ms                                  33 (  8%)
    > t > 1200 ms                                          184 ( 46%)
    > failed                                                13 (  3%)
    ---- Errors --------------------------------------------------------------------
    > java.net.ConnectException: Connection reset by peer                13 (100.0%)
    ================================================================================
You can see there was 400 requests as each user makes 2 requests. There were 13 timeouts, so maybe because of JIT compilation, let’s run test a second round:
    ================================================================================
    ---- Global Information --------------------------------------------------------
    > request count                                        400 (OK=400    KO=0     )
    > min response time                                      7 (OK=7      KO=-     )
    > max response time                                    679 (OK=679    KO=-     )
    > mean response time                                   193 (OK=193    KO=-     )
    > std deviation                                        215 (OK=215    KO=-     )
    > response time 50th percentile                         45 (OK=45     KO=-     )
    > response time 75th percentile                        404 (OK=404    KO=-     )
    > mean requests/sec                                171.969 (OK=171.969 KO=-     )
    ---- Response Time Distribution ------------------------------------------------
    > t < 800 ms                                           400 (100%)
    > 800 ms < t < 1200 ms                                   0 (  0%)
    > t > 1200 ms                                            0 (  0%)
    > failed                                                 0 (  0%)
    ================================================================================
Looks good, how about doubling number to 400 users at once, third round:
    ================================================================================
    ---- Global Information --------------------------------------------------------
    > request count                                        800 (OK=800    KO=0     )
    > min response time                                      7 (OK=7      KO=-     )
    > max response time                                   1443 (OK=1443   KO=-     )
    > mean response time                                   440 (OK=440    KO=-     )
    > std deviation                                        471 (OK=471    KO=-     )
    > response time 50th percentile                        200 (OK=200    KO=-     )
    > response time 75th percentile                        920 (OK=920    KO=-     )
    > mean requests/sec                                212.993 (OK=212.993 KO=-     )
    ---- Response Time Distribution ------------------------------------------------
    > t < 800 ms                                           541 ( 68%)
    > 800 ms < t < 1200 ms                                 183 ( 23%)
    > t > 1200 ms                                           76 ( 10%)
    > failed                                                 0 (  0%)
    ================================================================================
No failed requests, mean req/sec ~ 212. Let’s double users for forth round:
    ================================================================================
    ---- Global Information --------------------------------------------------------
    > request count                                       1600 (OK=1565   KO=35    )
    > min response time                                      4 (OK=4      KO=159   )
    > max response time                                   4167 (OK=4167   KO=1625  )
    > mean response time                                  1016 (OK=1016   KO=991   )
    > std deviation                                       1032 (OK=1041   KO=428   )
    > response time 50th percentile                        896 (OK=895    KO=1285  )
    > response time 75th percentile                       1515 (OK=1519   KO=1288  )
    > mean requests/sec                                228.571 (OK=223.571 KO=5     )
    ---- Response Time Distribution ------------------------------------------------
    > t < 800 ms                                           720 ( 45%)
    > 800 ms < t < 1200 ms                                 157 ( 10%)
    > t > 1200 ms                                          688 ( 43%)
    > failed                                                35 (  2%)
    ---- Errors --------------------------------------------------------------------
    > java.net.ConnectException: Connection reset by peer                35 (100.0%)
    ================================================================================
2% of failed requests but no error in logs (maybe we don’t handle that case yet). And in logs I’ve found:
java.sql.SQLTimeoutException: Timeout after 1015ms of waiting for a connection.
and more:
13:53:45.304 [main-akka.actor.default-dispatcher-82] ERROR c.s.b.Main$$anon$1 - Exception during client request processing: Task slick.backend.DatabaseComponent$DatabaseDef$$anon$2@71688eb2 rejected from java.util.concurrent.ThreadPoolExecutor@4131e49e[Running, pool size = 20, active threads = 20, queued tasks = 1000, completed tasks = 4067]
Let’s repeat, same setup, fifth round:
    ================================================================================
    ---- Global Information --------------------------------------------------------
    > request count                                       1600 (OK=1600   KO=0     )
    > min response time                                      4 (OK=4      KO=-     )
    > max response time                                   1905 (OK=1905   KO=-     )
    > mean response time                                   378 (OK=378    KO=-     )
    > std deviation                                        631 (OK=631    KO=-     )
    > response time 50th percentile                         57 (OK=57     KO=-     )
    > response time 75th percentile                        300 (OK=300    KO=-     )
    > mean requests/sec                                225.384 (OK=225.384 KO=-     )
    ---- Response Time Distribution ------------------------------------------------
    > t < 800 ms                                          1310 ( 82%)
    > 800 ms < t < 1200 ms                                  23 (  1%)
    > t > 1200 ms                                          267 ( 17%)
    > failed                                                 0 (  0%)
    ================================================================================
No failed requests this time,75th percentile means: 75% of requests handled within below 300 milliseconds.
Bootzooka scalatra version:
./gradlew -Dserver.port=8082 loadTest
First round:
    ================================================================================
    ---- Global Information --------------------------------------------------------
    > request count                                        400 (OK=284    KO=116   )
    > min response time                                     61 (OK=61     KO=10486 )
    > max response time                                  11823 (OK=11823  KO=11805 )
    > mean response time                                  5800 (OK=3502   KO=11426 )
    > std deviation                                       5640 (OK=5156   KO=199   )
    > response time 50th percentile                       1747 (OK=224    KO=11447 )
    > response time 75th percentile                      11470 (OK=11334  KO=11571 )
    > mean requests/sec                                 31.464 (OK=22.339 KO=9.125 )
    ---- Response Time Distribution ------------------------------------------------
    > t < 800 ms                                           200 ( 50%)
    > 800 ms < t < 1200 ms                                   0 (  0%)
    > t > 1200 ms                                           84 ( 21%)
    > failed                                               116 ( 29%)
    ---- Errors --------------------------------------------------------------------
    > regex(success).find(0).exists, found nothing                      116 (100.0%)
    ================================================================================
116 failed request, same case let’s give a JIT a chance. Second round:
    ================================================================================
    ---- Global Information --------------------------------------------------------
    > request count                                        400 (OK=327    KO=73    )
    > min response time                                      1 (OK=1      KO=4298  )
    > max response time                                   5015 (OK=5015   KO=4773  )
    > mean response time                                  2016 (OK=1449   KO=4556  )
    > std deviation                                       2279 (OK=2143   KO=101   )
    > response time 50th percentile                         67 (OK=53     KO=4576  )
    > response time 75th percentile                       4623 (OK=4583   KO=4627  )
    > mean requests/sec                                 67.261 (OK=54.986 KO=12.275)
    ---- Response Time Distribution ------------------------------------------------
    > t < 800 ms                                           222 ( 56%)
    > 800 ms < t < 1200 ms                                   6 (  2%)
    > t > 1200 ms                                           99 ( 25%)
    > failed                                                73 ( 18%)
    ---- Errors --------------------------------------------------------------------
    > regex(success).find(0).exists, found nothing                       73 (100.0%)
    ================================================================================
73 failed, ok it’s better then 116 but let’s keep it warming. Third round:
    ================================================================================
    ---- Global Information --------------------------------------------------------
    > request count                                        400 (OK=357    KO=43    )
    > min response time                                      1 (OK=1      KO=3261  )
    > max response time                                   3929 (OK=3929   KO=3667  )
    > mean response time                                  1505 (OK=1269   KO=3463  )
    > std deviation                                       1626 (OK=1563   KO=109   )
    > response time 50th percentile                        291 (OK=250    KO=3468  )
    > response time 75th percentile                       3507 (OK=3462   KO=3553  )
    > mean requests/sec                                  80.89 (OK=72.194 KO=8.696 )
    ---- Response Time Distribution ------------------------------------------------
    > t < 800 ms                                           229 ( 57%)
    > 800 ms < t < 1200 ms                                   9 (  2%)
    > t > 1200 ms                                          119 ( 30%)
    > failed                                                43 ( 11%)
    ---- Errors --------------------------------------------------------------------
    > regex(success).find(0).exists, found nothing                       43 (100.0%)
    ================================================================================
43 failed, number is decreasing but we see mean 80 req/sec with 11% of failures. Forth round:
    ================================================================================
    ---- Global Information --------------------------------------------------------
    > request count                                        400 (OK=339    KO=61    )
    > min response time                                      1 (OK=1      KO=2005  )
    > max response time                                   5830 (OK=5830   KO=5528  )
    > mean response time                                  2162 (OK=1648   KO=5021  )
    > std deviation                                       2601 (OK=2466   KO=957   )
    > response time 50th percentile                         61 (OK=21     KO=5370  )
    > response time 75th percentile                       5412 (OK=5318   KO=5451  )
    > mean requests/sec                                 58.651 (OK=49.707 KO=8.944 )
    ---- Response Time Distribution ------------------------------------------------
    > t < 800 ms                                           230 ( 58%)
    > 800 ms < t < 1200 ms                                   7 (  2%)
    > t > 1200 ms                                          102 ( 26%)
    > failed                                                61 ( 15%)
    ---- Errors --------------------------------------------------------------------
    > regex(success).find(0).exists, found nothing                       61 (100.0%)
    ================================================================================
61 failed, looks like won’t be better, however let’s double users to compare it with akka-http system. Fifth round:
400 requests at once:
    ================================================================================
    ---- Global Information --------------------------------------------------------
    > request count                                        800 (OK=572    KO=228   )
    > min response time                                      1 (OK=1      KO=1993  )
    > max response time                                  14464 (OK=14464  KO=14065 )
    > mean response time                                  5533 (OK=2370   KO=13468 )
    > std deviation                                       6667 (OK=5087   KO=1723  )
    > response time 50th percentile                        116 (OK=35     KO=13728 )
    > response time 75th percentile                      13715 (OK=144    KO=13827 )
    > mean requests/sec                                 50.614 (OK=36.189 KO=14.425)
    ---- Response Time Distribution ------------------------------------------------
    > t < 800 ms                                           458 ( 57%)
    > 800 ms < t < 1200 ms                                   5 (  1%)
    > t > 1200 ms                                          109 ( 14%)
    > failed                                               228 ( 29%)
    ---- Errors --------------------------------------------------------------------
    > regex(success).find(0).exists, found nothing                      228 (100.0%)
    ================================================================================
50 mean req/sec with 29% of failed and in app logs I see:
java.sql.SQLTimeoutException: Timeout after 1003ms of waiting for a connection.
Memory usage
In both cases, memory usage is comparable, I saw same 99.97% of jvm code throughput and even almost same number of GC pauses. I have two files but nothing spectacular here. The upper window is akka-http bootzooka version the lower is scalatra version.
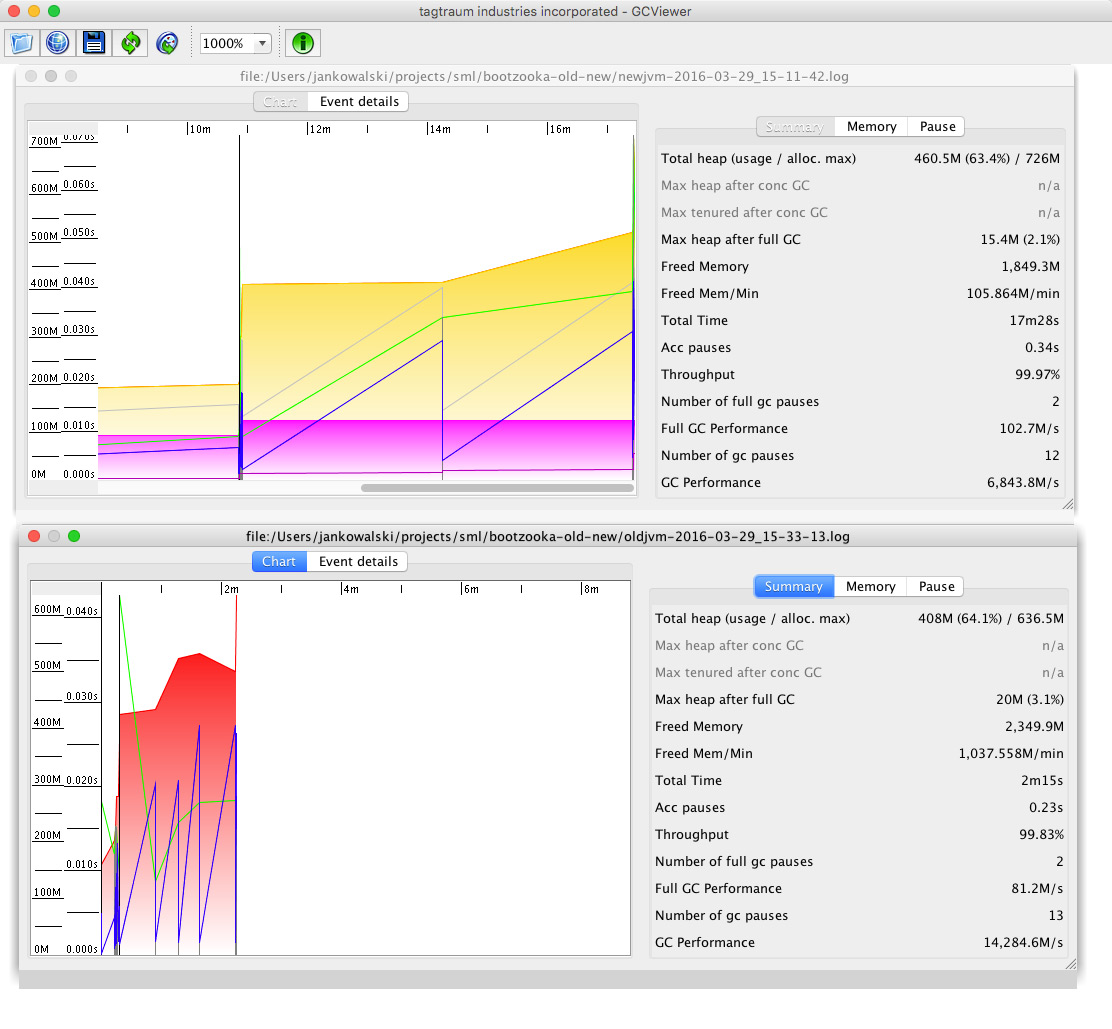
- newjvm-2016-03-29_15-11-42.log
- oldjvm-2016-03-29_15-33-13.log
Conclusion after scenario setup 1
This first scenario setup is naive and should show “something” and that is akka-http app behaves better than scalatra and continue to operate while getting bigger traffic too. Akka-http stops responding under much bigger load 800 users vs scalatra 200 users (mean 225 req/sec vs 50-80req/sec). It looks like akka-http version has better default configuration (thread pool size) and integrates well with slick
(functional relational mapping tool) and hikari-cp (tool that managed database connection pool) which overall handles resources in more efficient way.
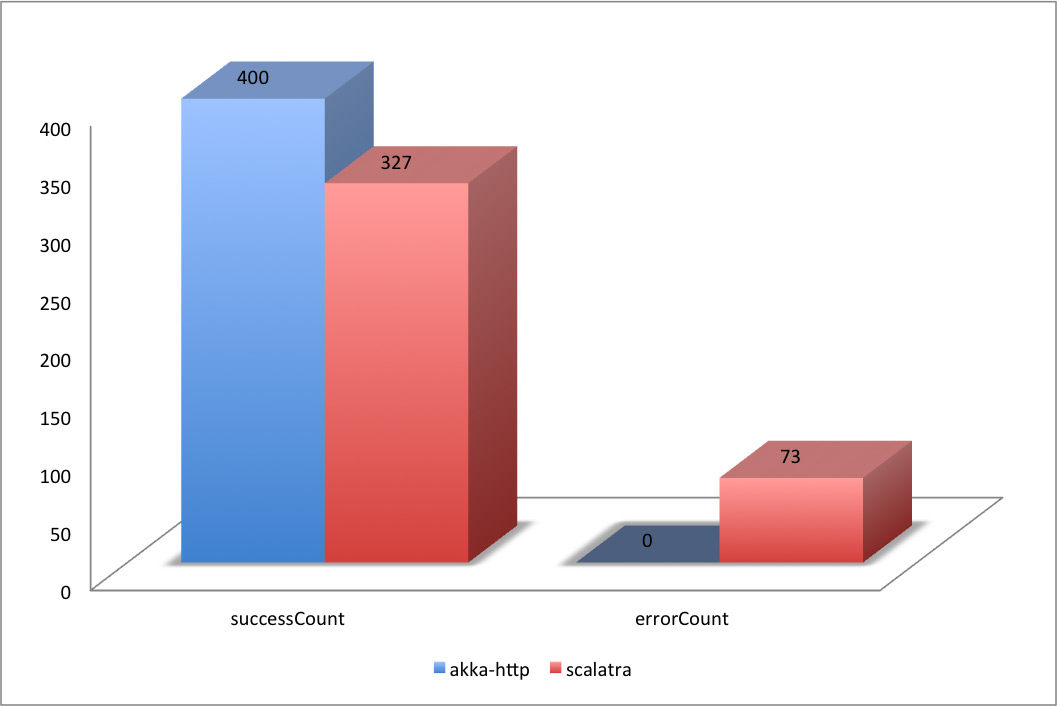
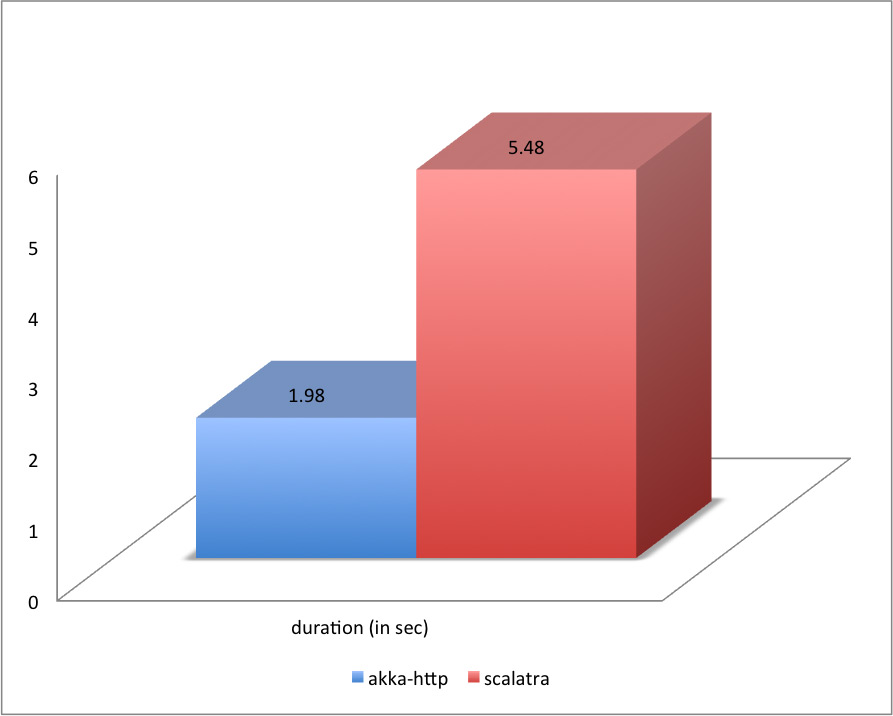
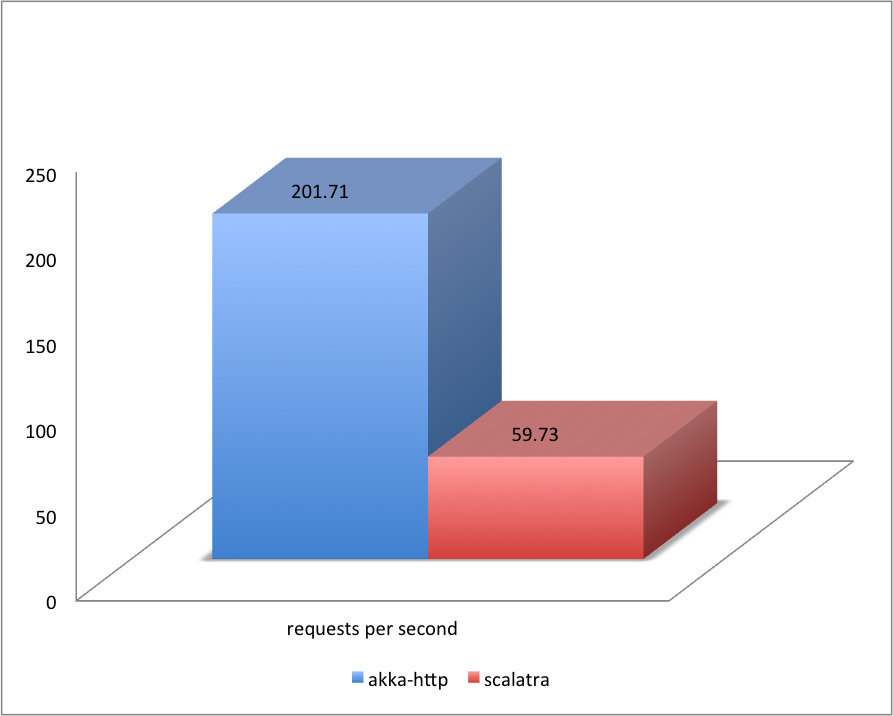
Comparison of second round of both frameworks:
For comparison I’ve used gatling-reports and the legend .
| simulation | duration | successCount | errorCount | min | p50 | p95 | p99 | max | avg | stddev | requestPerSecond | apdex | rating |
|---|---|---|---|---|---|---|---|---|---|---|---|---|---|
| akka-http | 1.98 | 400 | 0 | 4 | 43 | 581 | 678 | 679 | 191.2 | 217 | 201.71 | 1 | Excellent |
| scalatra | 5.48 | 327 | 73 | 0 | 65 | 4901 | 4984 | 5015 | 2014.55 | 2284 | 59.73 | 0.79 | Fair |
- duration = seconds
- succesCount = number of requests
- min, p50, p95, p99, max, avg, stddev = miliseconds
errors
Comparison of best runs for 200 users:
| simulation | duration | successCount | errorCount | min | p50 | p95 | p99 | max | avg | stddev | requestPerSecond | apdex | rating |
|---|---|---|---|---|---|---|---|---|---|---|---|---|---|
| akka-http | 1.98 | 400 | 0 | 4 | 43 | 581 | 678 | 679 | 191.2 | 217 | 201.71 | 1 | Excellent |
| scalatra | 4.49 | 357 | 43 | 0 | 259 | 3770 | 3869 | 3928 | 1473.31 | 1654 | 79.49 | 0.8 | Fair |
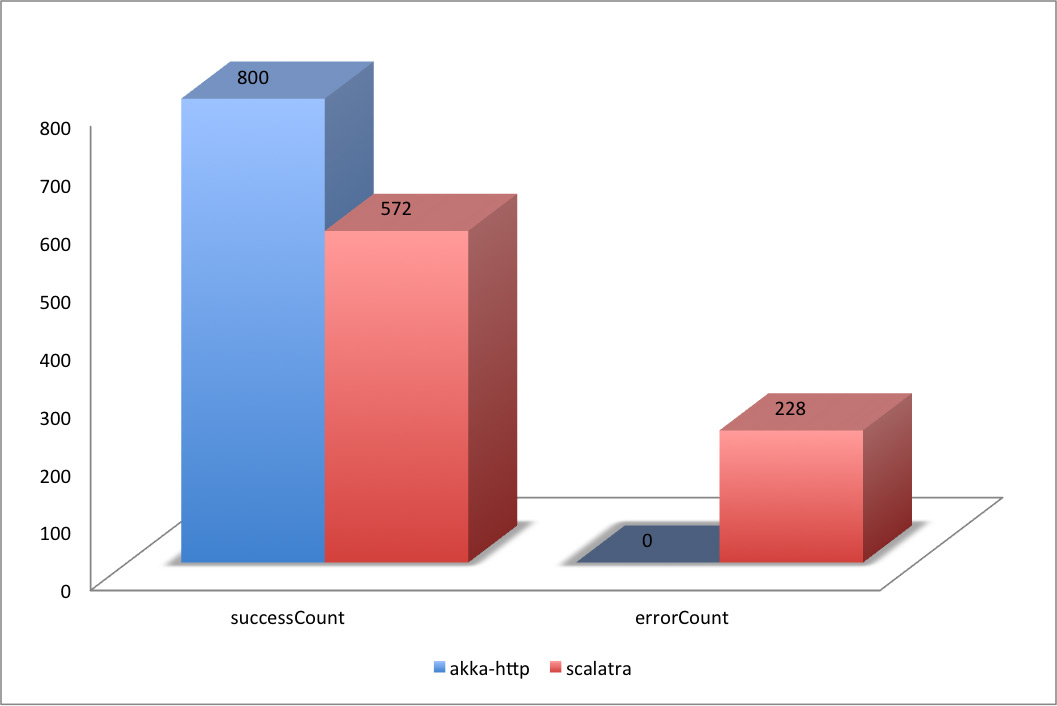
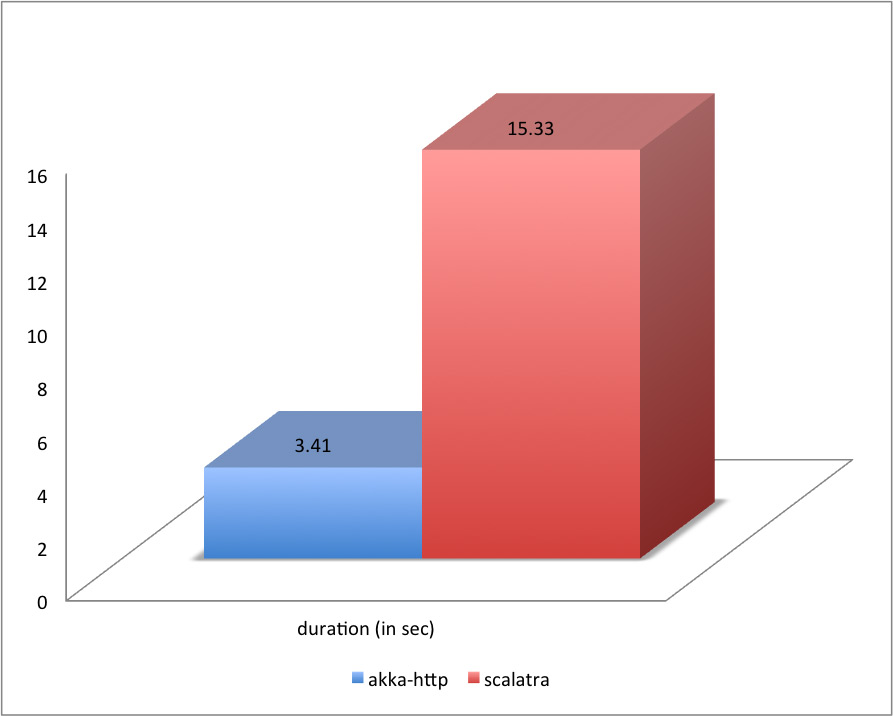
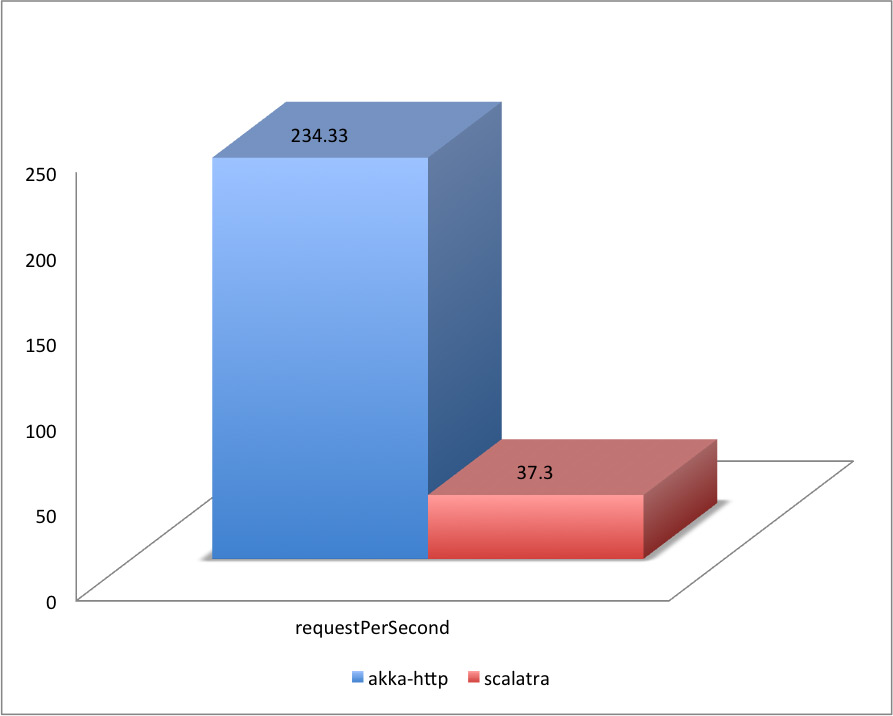
Comparison for 400 users:
| simulation | duration | successCount | errorCount | min | p50 | p95 | p99 | max | avg | stddev | requestPerSecond | apdex | rating |
|---|---|---|---|---|---|---|---|---|---|---|---|---|---|
| akka-http | 3.41 | 800 | 0 | 4 | 199 | 1390 | 1438 | 1443 | 436.42 | 474 | 234.33 | 1 | Excellent |
| scalatra | 15.33 | 572 | 228 | 0 | 111 | 14156 | 14398 | 14464 | 5529.42 | 6674 | 37.3 | 0.59 | Poor |
errors
Comparison for 800 users (where akka-http started to have a problems):
| simulation | duration | successCount | errorCount | min | p50 | p95 | p99 | max | avg | stddev | requestPerSecond | apdex | rating |
|---|---|---|---|---|---|---|---|---|---|---|---|---|---|
| akka-http | 8.69 | 1564 | 36 | 4 | 418 | 3095 | 3296 | 3345 | 1011.16 | 1117 | 180.06 | 0.85 | Fair |
Hints for tuning
Very often performance tests reveal that access to database is a bottleneck. In second (scalatra) of above cases we can observe it quite soon.
First natural approach is to increase the database connection pool what should suffice for a while. Increasing timeout is highly undesirable because it would only slow everything down. Another practise (this time expensive) is to set a database cluster or/and queue updates and queries to database. But any of that moves requires expertise knowledge in every of touched areas (like distributed setup of databases and applications). But that is not the case here, tests are being run on defaults.